Measuring bushfire fuels is important to many different people for so many different reasons;

Calculating the likely success of first attack; prioritising fuel reduction treatments; figuring out optimum fire frequency; calculating fuel accumulation rates; assessing risks and hazards; measuring carbon release; estimating smoke production (to name a few).

This project poses questions to those interested in fire fuels: Why collect fuels data? What do we seek to learn from fuels data? Should we collect fuels data across Australia in a uniform way? How would we store the information? What are the gaps in the knowledge about fuels? and more...

Tuesday, August 2, 2011

How Effective can Fuel Treatments be?

Dr Susan Prichard is a research scientist and the Manager of the Fuel Characteristic Classification System (FCCS), and works from the village of Winthrop, Washington, for the US Forest Service, Fire and Environmental Research Applications (FERA) Team through the University of Washington.  Susan oversees the development of improvements and enhancements to the FCCS, supervises the programmer and works with the scientist and mathematician who develops and adapts the equations that run data analysis within the system.

I spent some time discussing the way the FCCS works with Susan and Lucrecia Pettinari and if it could be adapted for different uses and for places elsewhere in the world.

Lucrecia Pettinari is a doctoral student from the Department of Geography, University of Acala in Madrid, Spain who is spending two months with the FERA team developing fuelbeds for the Fuel Characteristic Classification System (FCCS) in her project to map fire hazard at a global scale. An amazing project!
Me and Lucrecia Pettinari from Argentina in the Cascades

On our second day in Winthrop we went out in to the Okanogan National Forest and toured the margins of 2006 Tripod Complex Fires (80,000ha) where Susan had done some opportunistic research, post wildfire, to determine which fuel treatments may mitigate fire severity. Susan decided to do the research after she noticed small areas inside the burn perimeter that had not burned during the wildfire, adjacent to expansive regions of high burn severity in the devastating Tripod fires. She concluded that mechanical thinning followed by surface fuel removal (by Rx burning) at lower elevations can be effective in mitigating wildfire severity in (US) dry mixed conifer forest. If you are interested to read more, Susan's paper is here.
When the trees are killed it is known as a stand replacement fire

Thanks Dr Susan!


Getting My Eye In - Assessing Fuels Visually

Bob Vihnanek is a forester who leads the research support team for the Fire and Environmental Research Applications Team at the US Forest Service, Pacific Wildland Fire Sciences Lab. His research interests are in fire effects, fire history, and quantification of biomass as fuel.

Bob has been working on producing the Natural Fuels Photo Series (NFPS) for the last 30 or more years with Roger Ottmar and others. The NFPS are a set of photos with the associated fuelbed characteristics data. The data is collected through destructive sampling so it represents the actual quantification of fuels, at the sites that were selected to represent each fuel type and condition being documented. At present there are 15 volumes in the NFPS that record and quantify fuels data across regions within the US, with one volume each from Brazil and Mexico. The NFPS volumes are presented in ring bound folders printed on special, tough, almost waterproof paper that was designed to be taken out, and used in the field.

Sites include standard, wide-angle and stereo-pair photos. The inventory data that accompanies the photos summarises vegetation composition, structure and loading; woody material loading; density by size class; forest floor depth and loading, and other site characteristics. One vegetation type may have as many as 17 or more fuelbeds described in different conditions, such as in different seasons, when fuels can be radically different at exactly the same site.

The NFPS has also been digitised and is available on the web in electronic form. The Digital Photo Series (DFS) database allows for searching, downloading, side by side comparisons and customised site generation.

Out in the Okanogan National Forest on our trip to Winthrop, Bob demonstrated the use of the NFPS. He showed us how to use the pictures in the NFPS and match to the fuelbed under scrutiny. Parts or strata of one fuelbed can be combined with another fuelbed to construct a more representative assessment of the site and its fuels. As with all visual guides, practise makes perfect!

Bob explaining the use of the NFPS to Lucrecia and me, Jon checking data in the background

The selected fuelled for the site we were surveying

This is a squirrel midden! It contains chewed up nuts and seeds and is considered a jackpot fuel!

Roger being a good sport and showing me the old man's beard lichen 

Thanks Bob & Roger!

Character Building with Fuels

In Seattle, Washington, I met up with Dr Roger Ottmar and Bob Vihnanek, part of the Fire and Environmental Research Applications Team at the Pacific Wildland Fire Sciences Lab, for the US Forest Service.

On our first day together Roger outlined the Fuel Characteristic Classification System (FCCS) and Bob showed us the Natural Photo Series that we explored in more detail later in the visit. The next day together with Lucrecia Pettinari, an intern at the fire lab for the summer from Argentina via Spain working on a global application for fire fuels using the FCCS, and Jon Dvorak who manages the field crew that collect field data for the Natural Photo Series, we took a trip to Winthrop through the beautiful North Cascades Range to meet up with Dr Susan Prichard, the FCCS Manager.


Lucrecia and me in the snow in summer!

Liberty Bell in the Cascades

Along the Cascades Scenic Highway

Jon, Roger, Lu (partly obscured) & Bob sightseeing in the North Cascades


I learnt that the FCCS is a nationally consistent system that has been developed in the Pacific Wildland Fire Lab to help fire managers characterize fuels (known as fuelbeds), along with classifying the fuels by their potential flammability and fire hazard.

What these guys refer to as fuelbeds – or the specific form and quantity of fuels that result from particular vegetation types; natural and human induced disturbances; and seasons, are compiled by the user in the FCCS to approximate their local fuels and are then characterized and quantified by the software and further used to predict their relative fire hazard. The FCCS is designed to examine and characterize all the fuels in the fuelbed, including fuel characteristics and structural complexity.

Roger explained that there are 3 parts to the FCCS - the preloaded fuelbeds and customized fuelbeds; secondly the calculation of the physical characteristics; and third the calculation of fuel potentials, fire behaviour prediction. The FCCS also can make a correlation to the Anderson and Scott & Burgen fuel models (to build in a comfort factor for managers who are used to using these fuel models).

The fuel beds are made up of 6 strata (including canopy, shrub, non-woody, woody, litter lichen & moss and ground fuels) that are further divided into sub categories. For example canopy fuels are divided into trees, snags (stags), and ladder fuels. Ground fuels are divided in to duff, squirrel middens (yes this is a fuel type in the northern hemisphere!) and basal accumulations.

The FCCS predicts surface fire behaviour, including reaction intensity (BTU) flame length (ft) and rate of spread (ft min). Another very important output from the FCCS is the Fire Potential that rates surface fire behaviour potential, crown fire potential and available fuel potential using an easy to understand numbered system that can be used to describe or map fuelbeds in terms of fire hazard.  Each potential is rated separately and three numbers simplifies fire potential so that it can be easily explained and understood by anyone including non fire managers.
The system also generates a carbon report.
In Winthrop I was able to learn more about the intricacies of the system from Susan Prichard who manages the system as well as overseeing its further development and refinement.
Roger told me the FCCS is to be field validated as an upcoming project. Exciting!

Thanks Dr Roger, Bob, Lucretia, Jon and Dr Susan!


Wednesday, July 27, 2011

Grand ideas find fertile ground at the Tetons

In western Wyoming we met up with Diane Abendroth, Fire Ecologist and Ron Steffens, Fire Monitor who both work as part of Teton Interagency Fire, which brings together the Grand Teton National Park and the Bridger Teton National Forest for co-operative fire management.

Diane explained that the Fire Monitoring Handbook (FMH) was developed in the western parks in the late 1980’s and early 1990’s and was subsequently applied to parks across the country. The fuel sampling methodology however, was designed around the large charismatic mega trees and was much more applicable for those western parks than as a one size fits all monitoring approach. As Dianne commented - “You ride the horse you are feeding".

Over time it became apparent that it would be more appropriate to design fuel sampling around locally specific requirements and questions. As a result custom iterations of the Fuel Monitoring Handbook plots have been developed at the local level to take account of individual ecosystems. The bespoke plot methodology can then be used, for example, to analyse if the objectives of a particular prescribed fire were met, or perhaps to look at the regeneration of particular plants after fire.

Some of the monitoring plots are permanent, however most are set up as temporary or random plots. Naturally the sites locations are recorded with a GPS and can be re-visited if necessary. The methodology applied is less comprehensive and time consuming to set up and read (monitor) than the FMH plots. This means more plots can be established and read to provide a more robust statistical sample size. The data collected are generally quantitative although some of the plots employ qualitative assessment as with the Burn Severity Composite Burn Index that rates post fire effects (as in Grand Canyon NP) to calibrate the Landsat Fire Severity imagery. The main point was that the focus is only on collecting the data required.

The next day Diane and Ron took me for a hike through a burnt area that had partly experienced two fires in close succession. It was fascinating to see the regeneration and the relatively slow rate of re-accumulation of fuels compared with home.  I especially enjoyed hiking the back-country in such a beautiful national park on such a spectacular day. The Tetons towered overhead as elk called and wandered close by. Just brilliant!
The Tetons

regeneration of the forest


elk
Diane & Ron

Thanks Diane and Ron!    


Monday, July 25, 2011

Hi Tech in the Desert

Linda Wadleigh took me out to the Verde Valley to meet up with the Prescribed Fire & Fuels Specialist Scott Spleiss, the Forest Ranger Celeste Gordon, along with Ed Paul, Bucky Yowell and Corey Carlson who work together on fuels management, prescribed and wildfire in the Prescott and Coconino National Forests. As in many of the forests in this part of the country, there is a program to reintroduce fire into the vegetation communities to reinvigorate the forests, promote habitat as well as protect local communities from destructive fires.

Masticated fuels

Mineral earth break created by dragging a hunk of iron behind a  4 wheeler (quad bike)


The Natural Fuels Photo Series is used to estimate fuel loadings with photo points being used to monitor fuels, as well fuel moisture sampling to determine timing for burning. Scott demonstrated the Computrak Moisture Analyzer. Fuels are collected onsite in the forests at temporary sites within planned burn locations and stored in lidded cans for transport. To maintain the temperature and to ensure the fuels do not transpire the cans are kept in coolers until returning to the office for the analysis. The Computrak works by weighing the material then drying it and reweighing to give the fuel moisture content. It’s fast and only takes about 5 minutes to process one sample. The unit cost of the machine is quite expensive though at around $8,000 USD.
Computrak Moisture Analyzer

the dried fuels

readout of the Computrak

Prescribed burning in these forests is conducted on a broad scale at approximately 3,000 – 5,000 acres (1200 – 2000 ha) sized treatment blocks on average. Sometimes sections of the burn blocks are open ended with landscape features, or previously burnt areas or diurnal weather conditions being used to pull up a fire.

The Forest Service employs contractors to masticate fuels near settlements and assets such as camping areas to reduce fuels and prepare the boundaries of burn blocks. Prior to lighting up briefings are held in the conference room at the Verde Valley Center using Google Earth to fly over and familiarize crews with the topography of the blocks to be burnt. Google Earth is also used to brief management on the prescribed burning program to be undertaken for the year. Before we went out in the field Scott used Google Earth to show me where the field inspection was planned as well as explaining previous burn history and nearby assets and communities at risk. It was an excellent tool and a brilliant way to easily convey topographical information.

Linda Wadleigh, Smokey, and me


Thanks Linda, Scott, Celeste, Ed, Bucky & Corey!


Sunday, July 24, 2011

Just how Dry is that Fuel?


In Flagstaff we caught up with Linda Wadleigh a fire ecologist from the US Forest Service who introduced us to Wesley Hall who works on fuels for the Coconino National Forest.  Wes told us about how live fuel moisture sampling is conducted in the forest at permanent sites to guide timing for prescribed burning. The fuel moisture readings indicate when fuels are ready to burn in a controlled manner, as well as assisting in calculating how much fuel will be consumed during prescribed burning for emissions reporting. Fuel moistures can also be used predict wildfire behaviour.


Moisture in the 1000 hour fuel category (larger than 3 inches) is measured by placing sticks or small poles on the permanent sites. The sticks are allowed to acclimatise, then are cored every 15 days, with the sawdust being dried in a Computrac moisture analyzer. The moisture analyzer is a device from Arizona Instruments that was developed for measuring moisture in compounds such as chemicals and concrete and has been applied to measuring live fuel moisture. The fuels data collected by the US Forest Service is routinely contributed to the National Fuels Moisture Database.
me, Wes and Linda check out the fuels monitoring
1000 hour fuels - cored regularly to measure moisture

Wes and Linda took us out to check out the Remote Area Weather Station (RAWS) in the Coconino National Forest just outside Flagstaff. Aside from collecting the usual weather data, the RAWS monitors the moisture of 10 hour fuels (1/4 -1 inch in diameter) remotely using a probe. RAWS units collect, store and forward data to a computer system at the National Interagency Fire Center (NIFC) in Boise, Idaho, via a satellite. The data is automatically forwarded to several other computer systems including the Weather Information Management  System (WIMS) and the Western Regional Climate Center in Reno, Nevada.  
RAWS
10 hour fuels moisture collected by the RAWS

Linda showed us the Wildland Fire Decision Support System or WFDSS (pronounced “wiffdus”); a software tool available to fire managers in this country.  WFDSS is a set of modules that assist fire managers to predict fire behaviour as well as helping to guide tactical and strategic decisions, track and document decisions and evaluate the cost of a decision. It seems like a great online, one stop shop for fire managers.

Other fuels monitoring that is collected in the Coconino NF are ‘stand exams’ where Brown’s transects are used to quantify downed woody fuels.


Thanks Linda and Wes!


Sunday, July 17, 2011

Just How Severe was that Fire?

At Grand Canyon National Park we met Windy Bunn, the park’s fire ecologist along with Eric Gdula, the Fire GIS specialist, Li Brannifors, a recent visitor to Australia, and lead of the Fire Effects Team, also Christina, an intern working on collating and analysing weather data in the park for the summer.

Windy explained how the park is split into the management units of the north and south rim for fire management purposes. Fires that ignite inside the rim are not usually responded to due to low fuels, difficult access and low risk. She showed us how fire frequency is mapped over fire history to help inform planning for prescribed burning and to consider old burns for fire advantages in the case of managing wildfires.

Fire Return or Fire Frequency


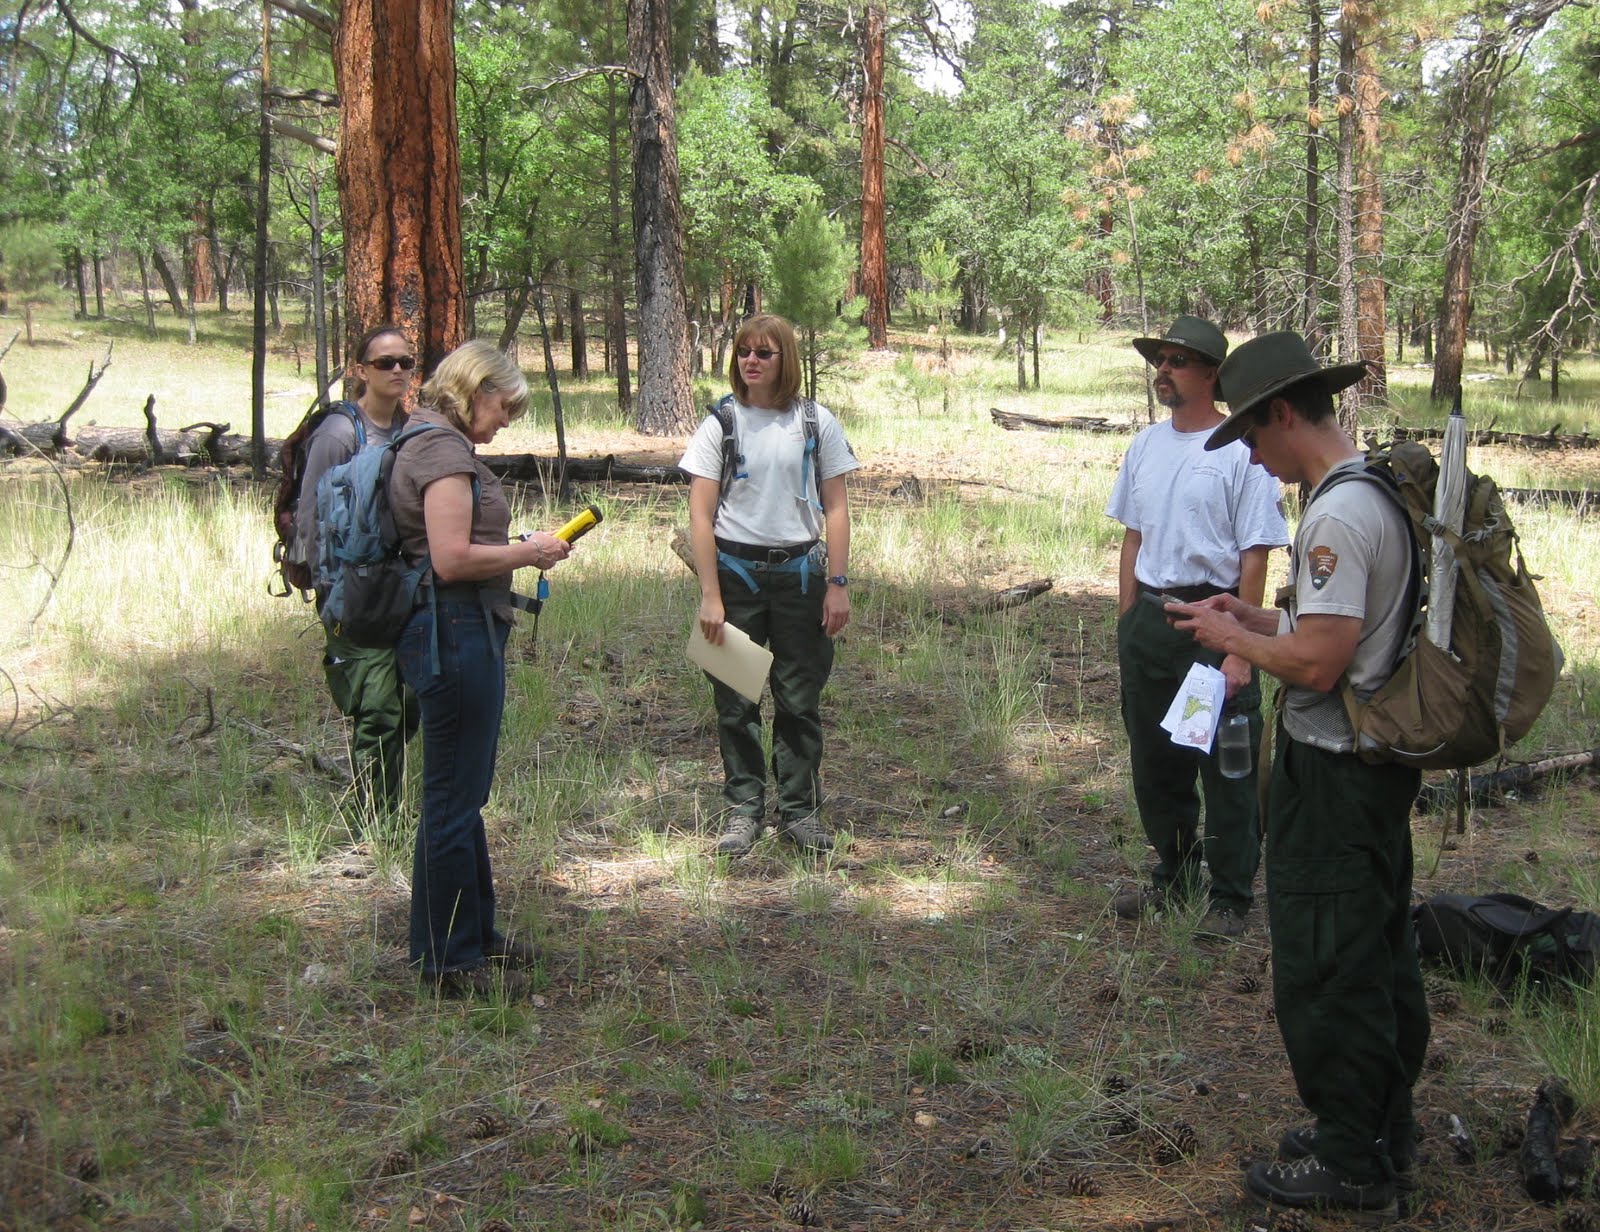
We went out in the field to see how the fire management team ground-truth Landsat images (maps) of fire intensity. A visual assessment is conducted after fires to calibrate the imagery produced by Landsat at a resolution of 30m pixels across the country. Actual fire severity is rated at a number of plots across each fire including planned and unplanned fires and is compared with the Landsat data, via a Trimble hand held tablet in the field. A proforma has been developed that qualitatively rates the post fire effects in the understory and overstory in a circular plot with a 15m radius. Assessment data is collected via the tablet and uploaded upon return to the office. Once there is confidence in the severity data, the Landsat image of the whole fire is recalibrated accordingly and a map produced that is used to inform planning for prescribed burning as well as identifying strategic advantages (areas of high severity) for controlling wildfires. The method has already proved successful assisting to control wildfires in the park.
Christina, me, Windy Bunn, Eric Gdula & Li Branifors ground truthing of Landsat imagery of fire severity
Fire severity mapping

Another map product that is produced at the Grand Canyon is a sensitivity map that helps inform planning for wildfires and prescribed treatments by identifying and mapping sensitive areas. These include archaeological sites – prioritised into high, moderate and low importance and areas that have been surveyed for archaeology (with nothing found), flora and fauna species that require special consideration, air quality stations (that they do mechanical treatments around) and research plots that need to have fire excluded.

Challenges for the Grand Canyon Team include considering the 5 or so million visitors they welcome into the park per annum, and the treatments around the Grand Canyon Village and park assets including historic buildings. Fuels in areas close to and within the village are hand cut and piled, then burnt during the winter.
Piles from mechanical hazard reduction - waiting for winter to burn

Christina, the summer intern was working on an interesting project assisting staff in the Regional office by collating weather data collected during prescribed burning and wildfire events so that it can be matched with fire behaviour records and success or failure of treatment or suppression activities. The resulting analysis will inform a set of weather prescriptions that are best for conducting burning, or conditions when wildfire can or cannot be controlled. A fascinating idea!

Smokey and me just outside the park in Coconino National Forest
Thanks Windy, Eric, Li and Christina!